Reading datas
In each asset, an Environmental impact tab is now visible.
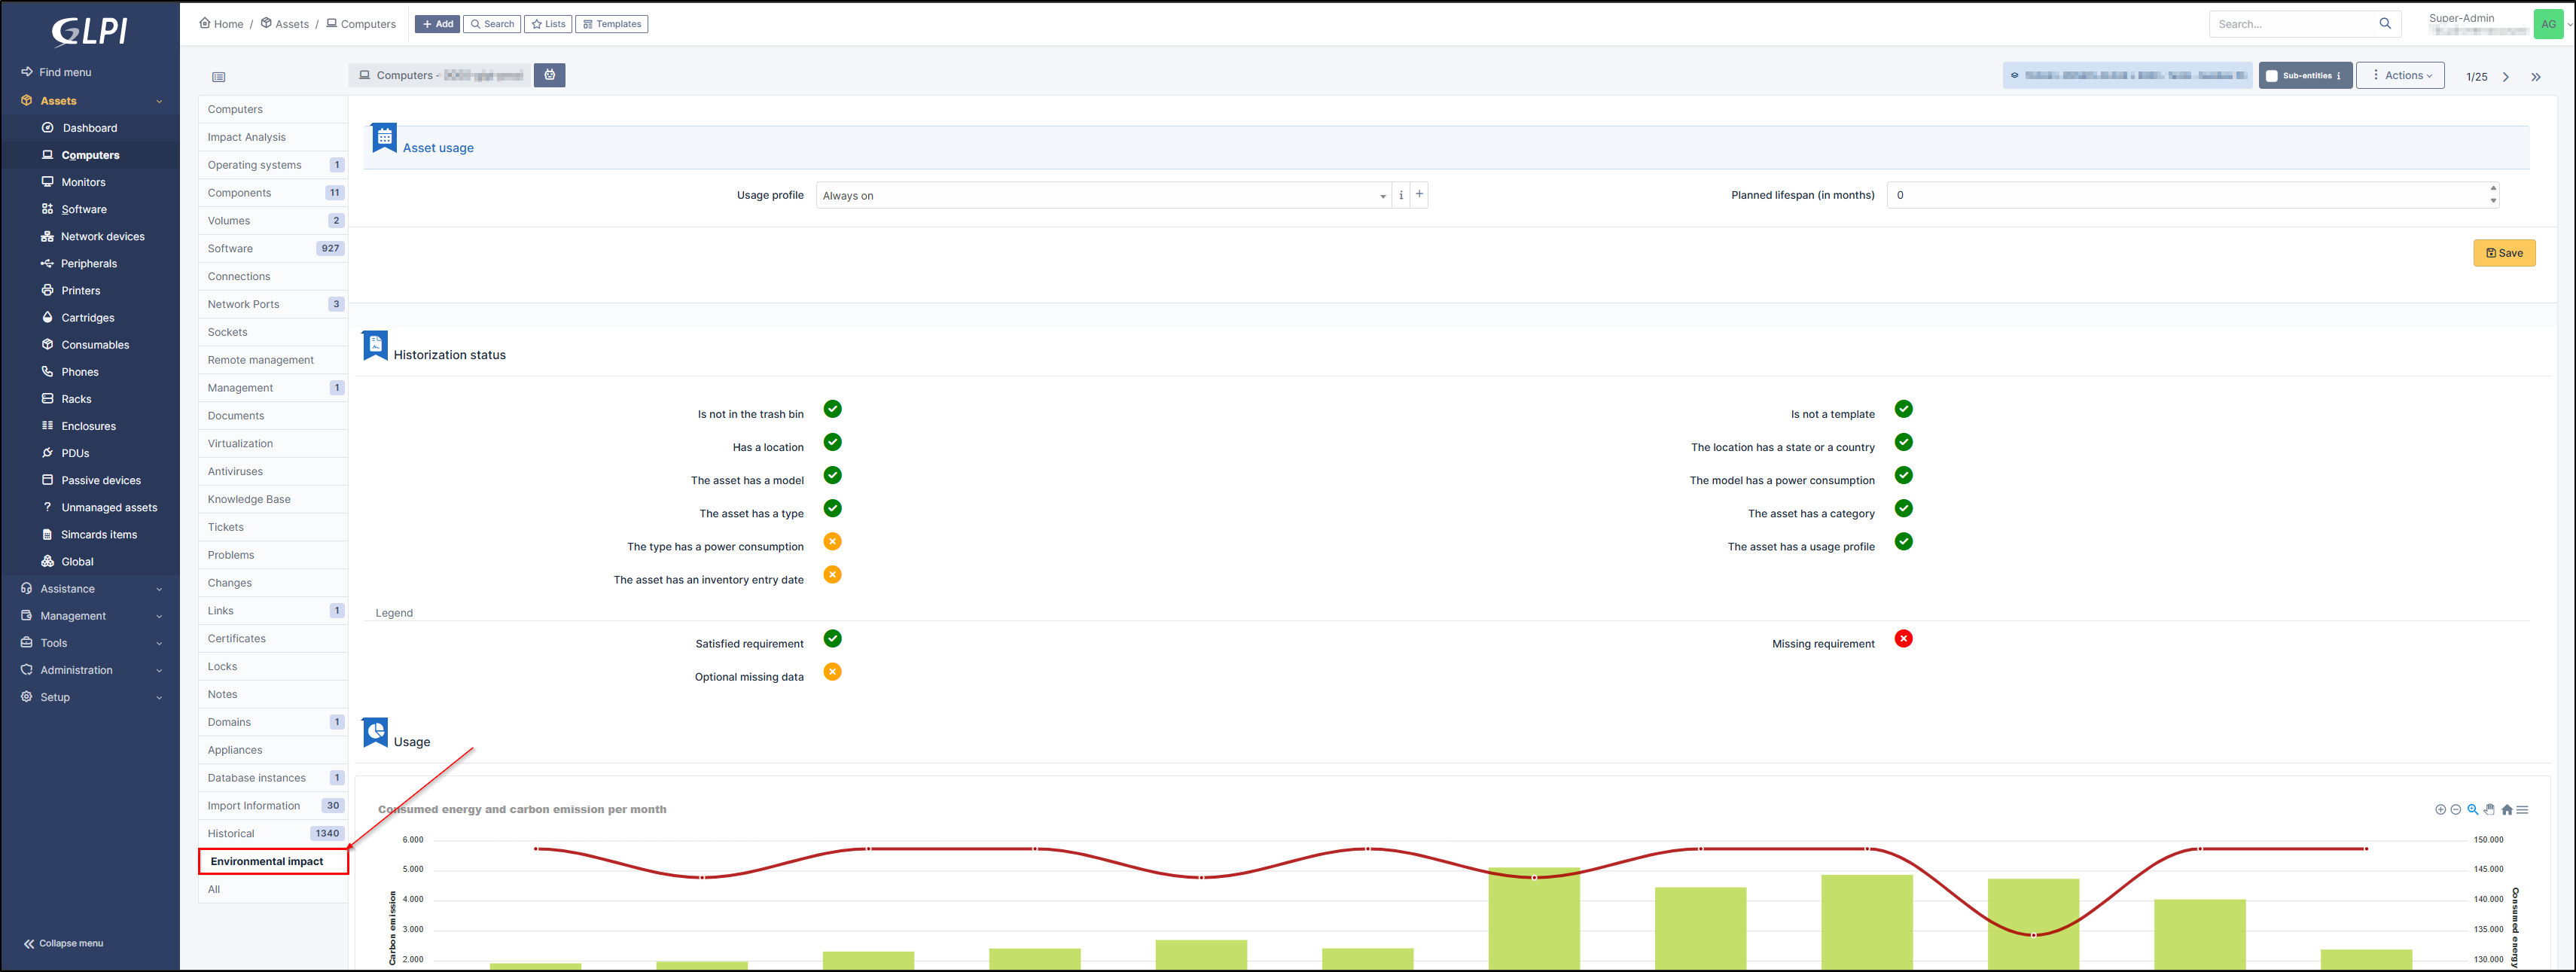
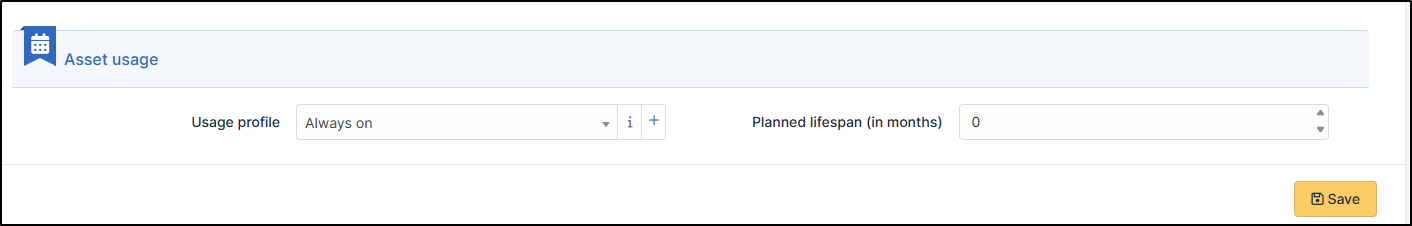
Asset usage
You can (for computers) select the appropriate profile as well as the planned lifespan (in months)
Historization status
The logging status tells you whether all requirements are correctly met, ensuring that the data sent by Carbon is as accurate as possible.
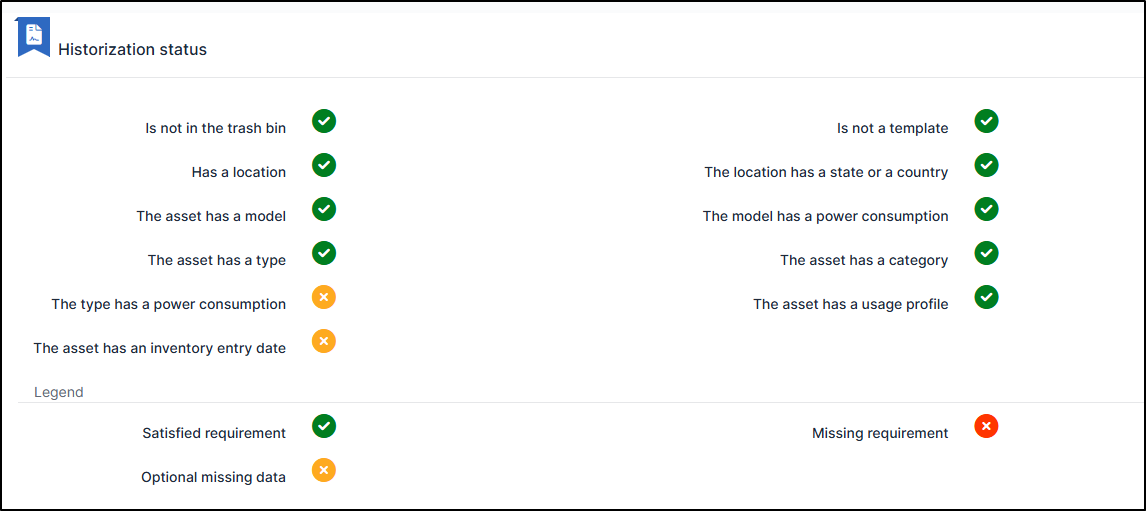
If an item is in red, the plugin will operate in a degraded manner, providing less accurate, aggregated estimation information. Data in orange are optional items with a slight impact on data quality
Usage
A graph displays energy consumption and carbon emissions per month for the last complete 12 months.
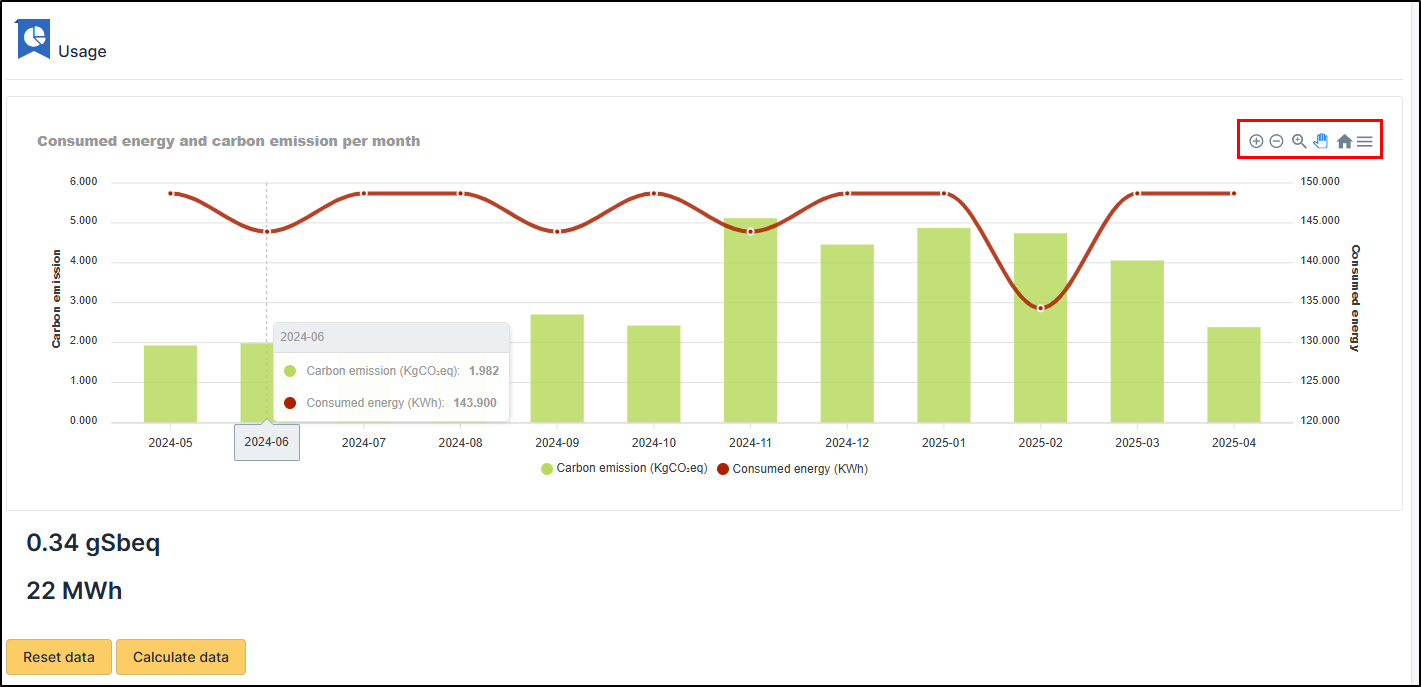
Consumption in appears in red
Carbon emissions in green
Using the toolbar at the top right, you can:
Zoom in/out on a specific period
Zoom through a selection
Scroll
Return to the initial presentation
Export (SVG, PNG, CSV)
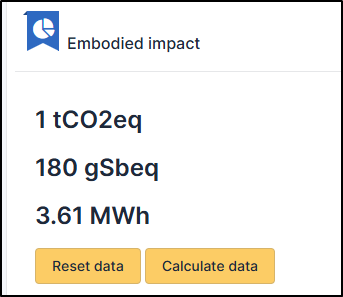
Additional data, gSbeq, is available.
These are grams of antimony equivalent. This index is used to measure the depletion of abiotic resources (rare earths, minerals, etc.).
You can reset and calculate this data with the corresponding buttons (There is an automatic action UsageImpact to set them if they are not already calculated.
The buttons may be useful to update values after a change of an asset property.)
Embodied data
In the life cycle of an asset, we can measure the environmental impact associated with its manufacture/destruction/recycling. This data is visible in this insert